
What Is Dollar-Cost Averaging?
Dollar-cost averaging is an investment strategy leveraged by investors to reduce their market risk and is done so by investing a pre-determined amount of money into the market periodically.
Steps to Dollar-Cost Averaging
1. Determine both the total amount of money you would like to invest into an asset and the total span of time you would like for it to take to all be invested.
2. Choose how many times you would like to periodically purchase the asset during the total span of time it will take for all of your money to be invested. Be sure to then divide the number of times you plan to periodically purchase the asset by the total span of time it will take for all of your money to be invested. The answer you get is how often each periodic purchase must occur during the total span of time you have chosen for all of your money to take to be invested.
3. Finally, divide the total amount of money you would like to invest into the asset by the total number of times you plan to periodically purchase it. The answer you get is the dollar amount needed to be invested into the asset for each periodic purchase.
4. By knowing how often each periodic purchase must occur and the dollar amount needed to be invested for each periodic purchase, you can now practice dollar-cost averaging into your asset of interest.
It’s important to note that for dollar-cost averaging to properly work, you must periodically purchase the asset of interest no matter its price.
How Dollar-Cost Averaging Works
With Dollar-Cost Averaging
| Date of Purchase | Amount Invested | Price / Share | Shares Purchased |
| Jul. 1, 2021 | $1000 | $433.72 | 2.305 |
| Aug. 1, 2021 | $1000 | $437.59 | 2.285 |
| Sep. 1, 2021 | $1000 | $453.19 | 2.206 |
| Oct. 3, 2021 | $1000 | $428.64 | 2.332 |
| Nov. 1, 2021 | $1000 | $461.90 | 2.164 |
| Dec. 1, 2021 | $1000 | $457.40 | 2.186 |
| Jan. 2, 2022 | $1000 | $477.71 | 2.093 |
| Feb. 1, 2022 | $1000 | $457.35 | 2.186 |
| Mar. 1, 2022 | $1000 | $437.89 | 2.283 |
| Apr. 3, 2022 | $1000 | $456.80 | 2.189 |
| May 1, 2022 | $1000 | $414.48 | 2.412 |
| Jun. 1, 2022 | $1000 | $417.39 | 2.395 |
| Total Amount Invested: | Average Price / Share: | Total Shares Purchased: | |
| $12000 | $444.50 | 26.996 |
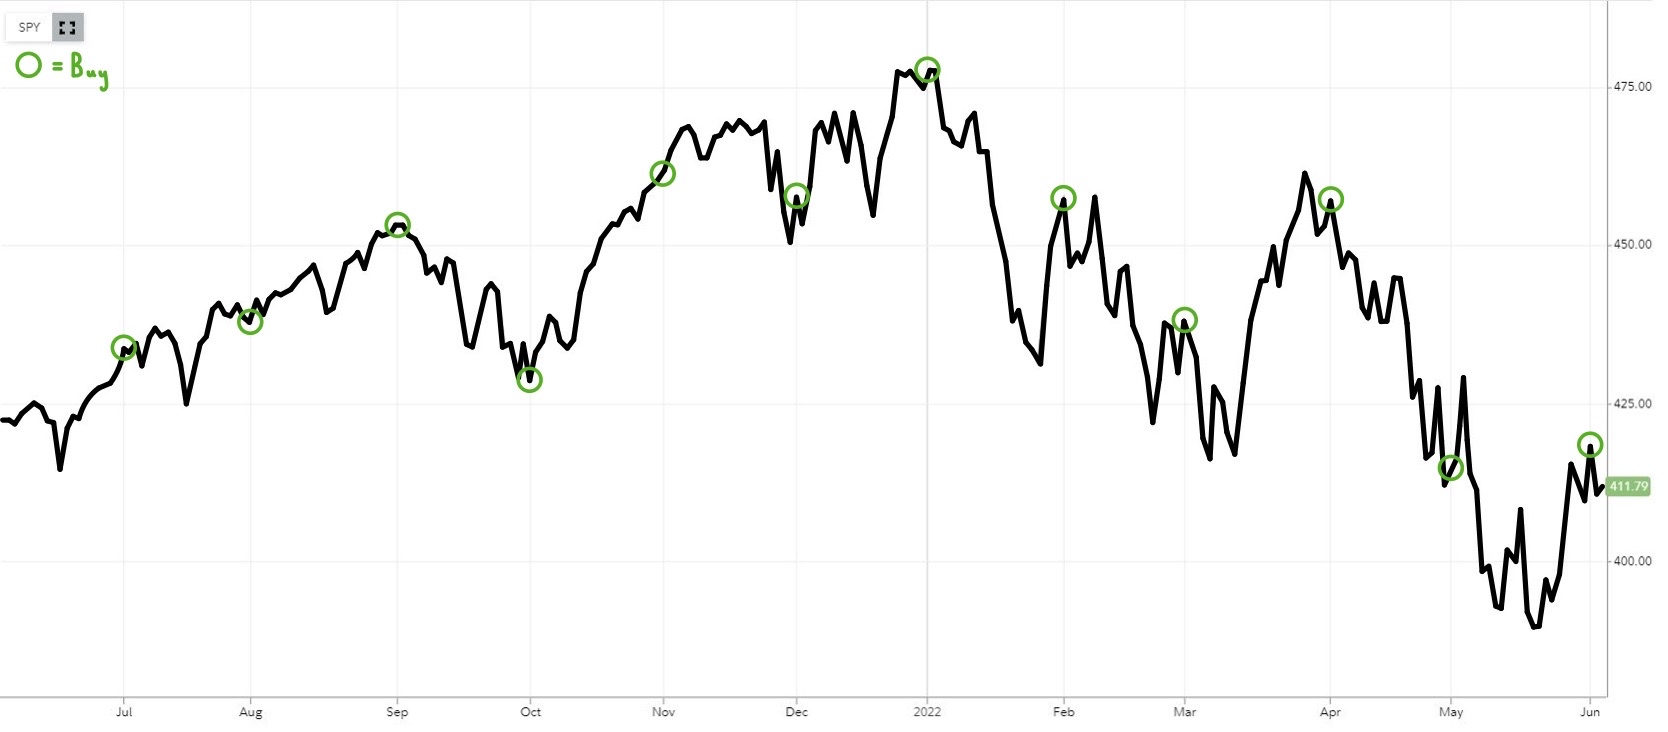
Above is a hypothetical example of an investor who dollar-cost averaged into the S&P 500 ($SPY). The investor began by first determining they would like to put a total amount of $12,000 into SPY across a total span of 12 months. They then chose to periodically purchase SPY 12 times within that total span of 12 months. The investor proceeded to divide the 12 periodic purchases of SPY by the total span of 12 months in order to figure out how often they would need to periodically purchase SPY. The investor realized they would need to periodically purchase SPY once at the beginning of each month. Finally, the investor divided the total amount of $12,000 by 12 periodic purchases of SPY to get the dollar amount needed to be invested into SPY for each periodic purchase. The investor understood they would need to invest $1,000 into SPY for each periodic purchase. After establishing how often each periodic purchase would need to occur and the dollar amount needed to be invested for each periodic purchase, the investor began to dollar-cost average into SPY.
In result of dollar-cost averaging into SPY, the investor practiced a safe investment strategy and managed to acquire 26.996 shares of SPY at an average price per share of $444.50.
Without Dollar-Cost Averaging
| Date of Purchase | Amount Invested | Price / Share | Shares Purchased |
| Nov. 1, 2021 | $12000 | $461.90 | 25.979 |
| Other Months | $0 | $0 | 0 |
| Total Amount Invested: | Average Price / Share: | Total Shares Purchased: | |
| $12000 | $461.90 | 25.979 |
Above is a hypothetical example of an investor who didn’t dollar-cost average and instead tried to time the market by investing all of their money into the S&P 500 ($SPY) on Nov. 1, 2021. This point in time happened to be the second highest peak that SPY managed to reach when only taking into consideration the green circles seen on the S&P 500 ($SPY) 12-Month Chart.
In result of trying to time the market when investing in SPY, the investor practiced a risky investment strategy and managed to only acquire 25.979 shares of SPY at an average price per share of $461.90.
Conclusion
Dollar-cost averaging proved to be more effective than trying to time the market when purchasing SPY in this example. This is evident as the investor who dollar-cost averaged managed to acquire 26.996 shares of SPY, whereas the investor who tried to time the market only acquired 25.979 shares of SPY. The investor who dollar-cost averaged accumulated 1.017 more shares of SPY than the investor who tried to time the market. Furthermore, the investor who dollar-cost averaged had an average price per share of $444.50, which is $17.40 cheaper than the average price per share of $461.90 coming from the investor who tried to time the market.
Benefits of Dollar-Cost Averaging
■ Can Be Practiced by Anyone
No matter how much money or how often an investor may choose to invest, it’s always possible to practice dollar-cost averaging. For this reason, it’s easy to adjust your dollar-cost averaging plan as your financial situation changes over time.
■ Eliminates Having to Time the Market
Most investors have trouble choosing when to invest their money due to them worrying if it’s the best time to do so. This is a common problem to have as the market can almost never be timed. By dollar-cost averaging, an investor can eliminate the worry of when to invest through periodically purchasing an asset at many different times and price levels.
■ Takes the Emotion Out of Investing
Investing can be stressful, but going in with a plan can make it much more enjoyable. Dollar-cost averaging provides a strong investment strategy to any investor who is looking to prevent their emotions from making poor investment decisions.
Thank you for reading this article. If you would like to get in contact, be sure to email me at colbylarson00@gmail.com. Below are my various social media links where you may further interact as well.


hello!,I like your writing so much! share we communicate more about your article on AOL? I need an expert on this area to solve my problem. Maybe that’s you! Looking forward to see you.
Hello there! Do you use Twitter? I’d like to follow you if that would be okay. I’m definitely enjoying your blog and look forward to new posts.
You made some decent points there. I did a search on the subject and found most persons will agree with your blog.
I was very pleased to find this web-site.I wanted to thanks for your time for this wonderful read!! I definitely enjoying every little bit of it and I have you bookmarked to check out new stuff you blog post.
Great V I should definitely pronounce, impressed with your web site. I had no trouble navigating through all the tabs as well as related info ended up being truly simple to do to access. I recently found what I hoped for before you know it at all. Reasonably unusual. Is likely to appreciate it for those who add forums or something, website theme . a tones way for your customer to communicate. Nice task..
I like this website so much, saved to my bookmarks. “To hold a pen is to be at war.” by Francois Marie Arouet Voltaire.
Hello, Neat post. There is an issue along with your website in internet explorer, could test this?K IE still is the marketplace chief and a big component of people will miss your fantastic writing because of this problem.
It is truly a nice and helpful piece of info. I¦m happy that you shared this helpful info with us. Please keep us up to date like this. Thank you for sharing.
ishokhmedoojzwigwyhgyttwxwrgvt
Great wordpress blog here.. It’s hard to find quality writing like yours these days. I really appreciate people like you! take care
Saved as a favorite, I really like your blog!
Hello.This post was really interesting, especially because I was looking for thoughts on this subject last Thursday.
mhrlmjmslilokoxfnjpnpykhlpmnur
Terrific paintings! This is the type of info that are supposed to be shared across the net. Disgrace on Google for no longer positioning this post upper! Come on over and discuss with my site . Thanks =)
order thc capsules online for precise controlled dosing
apkwiv
It¦s really a cool and useful piece of info. I am glad that you shared this useful info with us. Please stay us up to date like this. Thank you for sharing.
You should take part in a contest for one of the best blogs on the web. I will recommend this site!
Its such as you read my thoughts! You appear to grasp so much approximately this, like you wrote the e book in it or something. I think that you can do with some percent to drive the message home a little bit, however instead of that, this is great blog. A great read. I’ll certainly be back.
I love it when people come together and share opinions, great blog, keep it up.
Really enjoyed this article, is there any way I can get an update sent in an email when there is a new post?
ppc559
udrvgq
Pingback: mylan tadalafil vs cialis
באשדוד המדהימה תוכלו לקבל
עיסוי רפלקסולוגיה וטיפולי גוף מקלים
במיוחד כאבי שרירים?
This post will help the internet users for setting up new blog or even a blog
from start to end.
I read this piece of writing completely on the
topic of the difference of most up-to-date and preceding
technologies, it’s remarkable article.
What’s Happening i’m new to this, I stumbled upon this I have
found It positively useful and it has helped me
out loads. I’m hoping to contribute & help different users like its aided
me. Great job.
We’re a bunch of volunteers and opening a new scheme in our
community. Your site provided us with helpful information to work on. You’ve
done a formidable job and our whole group will be grateful to you.
Hi there friends, fastidious piece of writing and nice arguments commented here,
I am genuinely enjoying by these.